Performance Bottleneck Analysis with the Extended Roofline Model (ERM)
Explanation
In this work we propose an extension of the roofline model [2] that includes an extended set of hardware-related bottlenecks including throughput, latency, capacity information of a multi-level memory hierarchy, and out-of-order execution buffers. The result is a generalized roofline plot that integrates all derived hardware-related bottlenecks as performance bounds into one viewgraph that shows their relative importance.
Background: Roofline Model
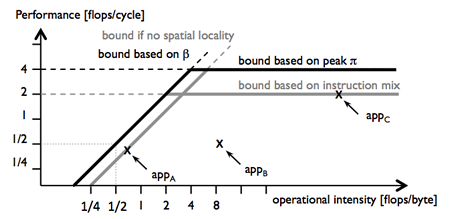
The roofline model [2] identifies and visualizes performance bottlenecks. The plot below shows an example of a roofline plot. It depicts the performance of three applications as a function of their operational intensity. The roofline model clearly identifies bottlenecks due to the computational throughput (appA) and the memory bandwidth (appC). However, the original model is inherently blind to bottlenecks due to non-throughput resources such as cache capacity, latency of memory accesses or the functional units, and out-of-order (OoO) execution buffers: e.g., for appC in the figure below the bottleneck is undetermined.
DAG-based Performance Model
Our bottleneck analysis extends the roofline model and plot. Whereas in the original roofline model, the microarchitecture is only described by computational and memory throughput, we use a performance model that captures a microarchitecture by a larger set of more than 20 parameters specifying throughput, latency, and size information of a multilevel memory hierarchy and reorder buffers.
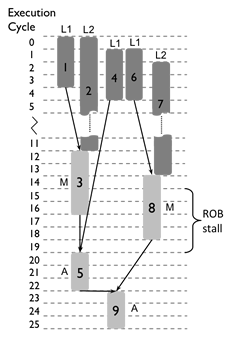
First we schedule the computation DAG of a kernel on an this extended microarchitecture model. The result is a scheduled DAG as the one shown on the left. From this scheduled DAG we extract resource utilizations that are used to obtain bounds on attainable performance. These new bounds on performance are included as additional bottleneck lines (drawn as dashed lines) in the original roofline plot.
Experiments
We apply our bottleneck analysis to a number of numerical kernels. In all our experiments we model an Intel Xeon microarchitecture.
Basic Validation: Reduction
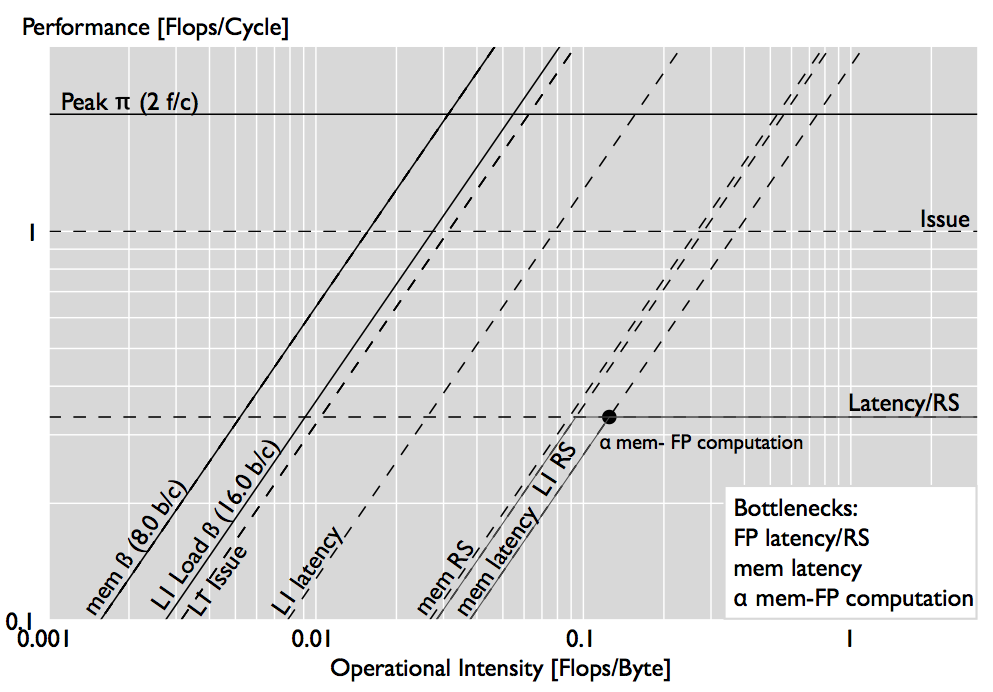
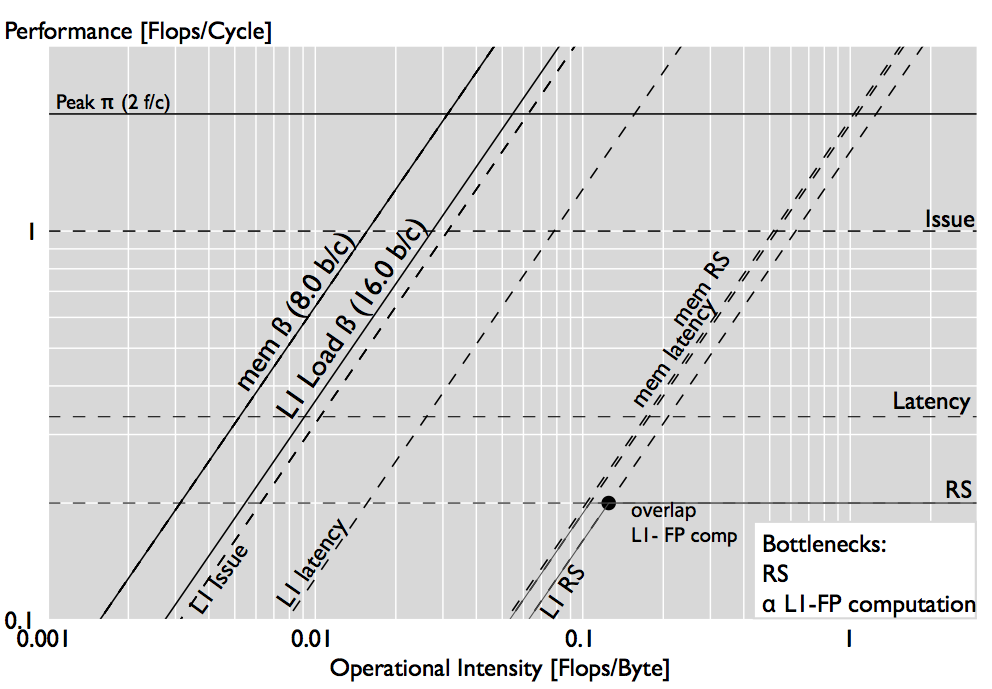
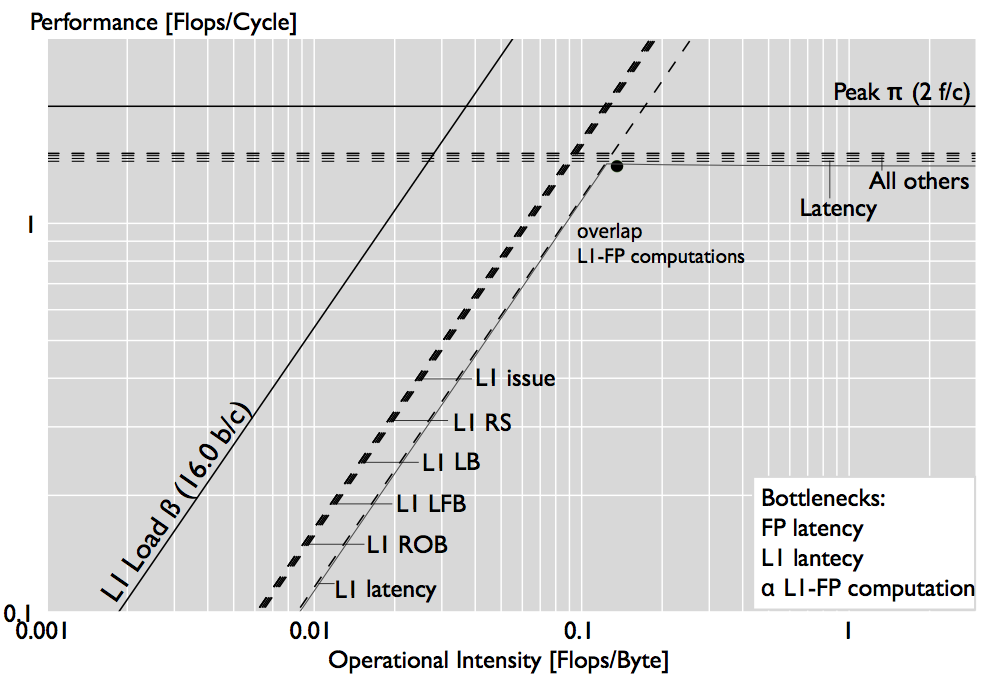
The plots below show our generalized roofline plot for a large iterative vector sum reduction. As expected, the plot identifies the latency of floating-point computations as a bottleneck (the bottleneck line hits the performance point). However, the performance point hits two additional bottleneck lines, the memory bandwidth and the RS stall bottleneck. The first can be expected in a cold cache scenario, but the RS stall bottleneck may not be so obvious. To show that the RS can indeed be a bottleneck, we reschedule the DAG by further reducing the RS and obtain the second plot: the performance actually drops by 40\% when the RS is reduced.
 |
 |
Increasing Size
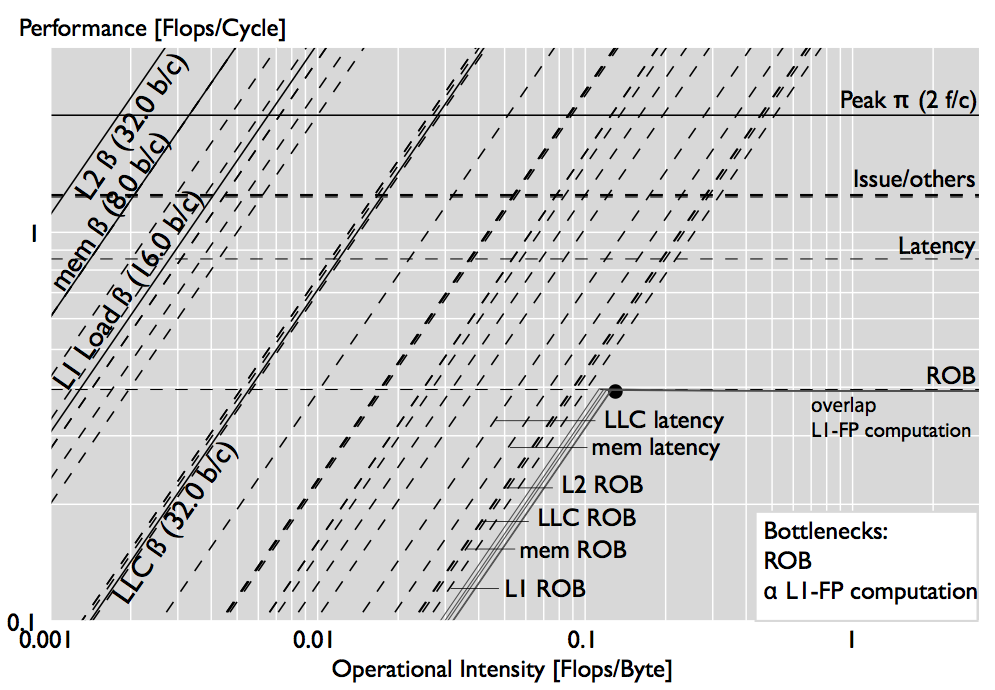
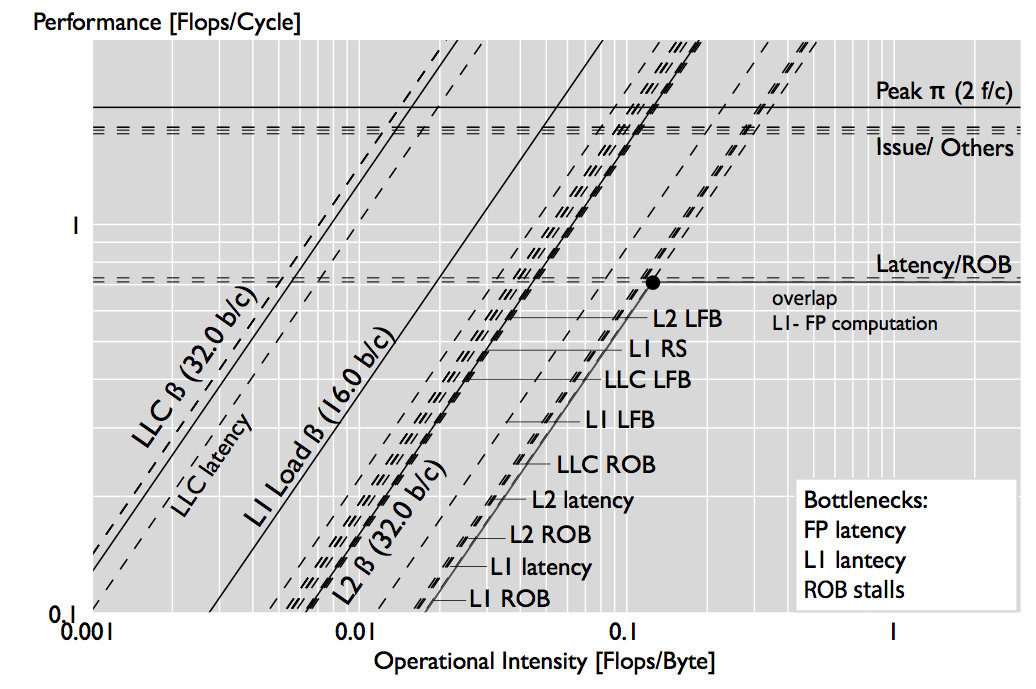
We study how bottleneck change with the input size. The plots below show out analysis for FFTs of sizes $2^10$ and $2^20$. For the small size, L1 latency and bandwidth is the limiting resource and the peak is not reached because of latency effects. For larger sizes, more bottleneck lines appear because the application accesses more levels of the memory hierarchy, and new execution stalls due to OoO buffers appear, being the ROB stalls the one that contribute the most to performance.
 |
 |
Different optimizations of the same application
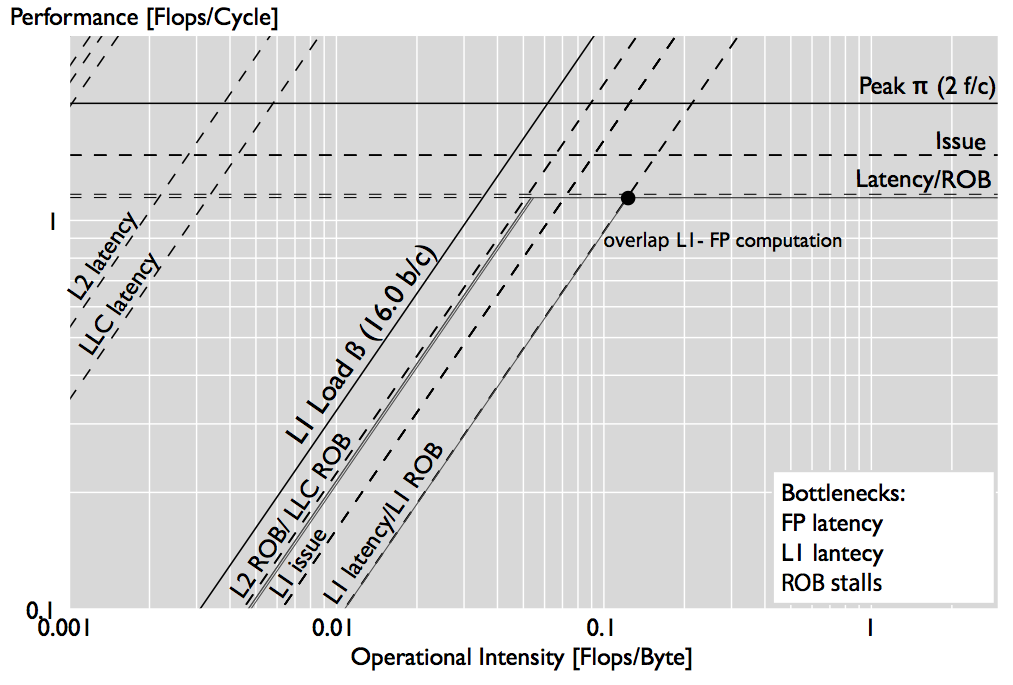
Finally, in the figure below we compare how bottlenecks change across different implementations of matrix-matrix multiplication (MMM) of square matrices of size 500, a triple loop implementation (left plot) and a six-fold loop version (right). While in the blocked implementation only the L1 latency appears as a bottleneck, in the triple loop implementation, the L2 latency limits performance as much as the L1 latency.
 |
 |
Source
The source code of the tool (implemented within the LLVM interpreter) used to generate the scheduled execution DAGs can be found here: ERM.
References
-
Victoria Caparros and Markus Püschel
Extending the Roofline Model: Bottleneck Analysis with Microarchitectural Constraints
Proc. IEEE International Symposium on Workload Characterization (IISWC), pp. 222-231, 2014 -
Samuel Williams, Andrew Waterman, and David Patterson
Roofline: an insightful visual performance model for multicore architectures
Communications ACM 55(6): 121-130 (2012)